

Report for the Council of Europe
E-Voting in the 2005 local elections in Estonia
Authors of this report:
Fabian Breuer and Alexander H. Trechsel, European University Institute
Project leaders:
· Prof. Dr. Alexander H. Trechsel, European University Institute, Florence, Italy & Director of the e-Democracy Centre (e-DC), University of Geneva, Switzerland
· Ivar Tallo, Director of the e-Governance Academy, Tallinn, Estonia
Florence, March 6 2006
Contents
1 Introduction
2 Context: E-voting in the Estonian local elections in October 2005
3 Goals of the study
4 Methods
5 Participation in the elections of 16 October 2005: general aspects
6 Choosing the internet for voting: three explanatory models
7 Conclusions
8 Recommendations
9 Executive Summary
1 Introduction1
This report aims to analyse the results of a telephone survey on the municipal elections held in Estonia on 16 October 2005. The focus of the report as well as the survey lies on the newly introduced possibility of casting a vote via the internet in Estonia. Last year’s introduction of e-voting in Estonia represents a true world-première: even though internet voting has so far been used in many consultative decision making processes around the globe, in private elections and in a number of formally binding referendums, the local elections in Estonia were the first time that an electorate of an entire country could cast its vote over the Internet in a public election. The present report seeks to show what voting channels have been used by what type of citizens and will inform its readers about participation patterns and political behaviour of the citizens in these elections. The overall project is lead by Alexander H. Trechsel and Ivar Tallo. This report is authored by Fabian Breuer and Alexander Trechsel.
The specifically designed telephone survey was conducted among 939 Estonian voters who had the right to cast their ballot in the elections of 16 October. The sample, which consists of 315 e-voters, 319 ‘traditional’ voters and 305 non-voters, allows us to conduct a significant and rich analysis of voting channels and voting behaviour of the Estonian electorate.
By analysing the participation patterns and the political behaviour of the citizens we will be able to shed further light on a number of relevant socio-political questions concerning this new mode of political participation. Furthermore, selective comparisons with other survey data from online-surveys in Estonia as well as from surveys in other contexts will be added in our future work. In order to allow for comparative insights, both the questionnaire and the sample of the survey were built on previously undertaken surveys, particularly those in the Canton of Geneva, Switzerland.
The next section of the report consists of an introduction to the context of the Estonian local elections held in October 2005. The goals of the study will be discussed in more detail in section three. Section four stresses the methods and the research management of the study while the fifth section highlights results concerning participation in the elections. The sixth section of the report forms the main analytical part of this report. It contains various analyses, both bi-variate and multivariate, of why Estonians chose to (respectively refrained from) voting over the internet in the October 2005 local elections. Section seven concludes this report, summarizing our main findings.
2 Context: E-voting in the Estonian local elections
- Estonia and ICT in general
Overall, Estonia - which is often referred to as “e-stonia” - is considered to be a leading country when it comes to the use of ICT-technologies and the internet in the private as well as in the public sector. Estonia is the only country in Europe where access to the internet is legislated as a social right. 54% of the population are internet users, 34% of the households have a computer at home and 82% of these computers are connected to the internet (which means that 60% of the inhabitants have internet-connected computers at their homes). Additionally, all Estonian schools are connected to the internet and 750 public internet access points. Income tax declarations can be made electronically via the Internet (in 2005, 76% of Estonian taxpayers declared their income tax via the Internet), expenditures made by the government can be followed on the Internet in real-time and cabinet meetings have been changed to paperless sessions using a web-based document system.2
The Estonian governing bodies actively support the development of a society using up-to-date information and communication technologies. The striving for a strong information society is summarised in the following words in a publication of the Ministry of Foreign Affairs: “Estonia has in a short time caught up with advanced countries in terms of information and communication technology (ICT) infrastructure and in the use of ICT in society. Attitudes favouring ICT, innovative thinking and progressive ICT entrepreneurship, have developed a strong technological infrastructure in Estonia. These factors combined with strong economic growth as well as macroeconomic stability form a favourable basis for further development”.3
To reach this aim, the “Principles of the Estonian Information Policy 2004-2006” were adopted to “strengthen the central IT co-ordination and increase consistency and collaboration in developing the information society”.4 The objectives of the Estonian information policy for the upcoming years are the introduction of e-services in all state agencies and training and knowledge-raising activities for the whole society. Next to strengthening the efficiency of the Estonian economy and society, the policy aims to adopt more closely national actions with EU priorities (particularly the objectives set out in the eEurope 2005 action plan5).
Additionally, an information technology action plan is annually approved by the government to set out information policy priorities. The Ministry of Economic Affairs and Communications6 is responsible for the co-ordination and management of the action plan, which presents the activities that state agencies are planning for the development of the information society. Various projects aim at developing and integrating ICT infrastructures of state and local governments into a citizen-friendly service. Amongst other things, policy priorities in 2005 were the development of an open GIS system, further electronic document management and archiving systems in the public sector, further development of a population information system and redesign of ICT systems in the field of education and science.
Other significant projects related to the further development of an ICT-society are the eCitizen portal7, the eGovernment portal8, the eSchool project9 and the X-Road project10.
E-voting in the local elections of October 2005: the context
On Sunday, 16 October 2005, Estonia held its local elections. Following years of preparation and both political and legal controversy, Estonian citizens equipped with an electronic ID-card were able to cast their vote via the Internet. Internet voting in the elections took place from Monday, October 10 to Wednesday, October 12 2005. Overall, 9317 voters have used this newly introduced means of participation. This number corresponds to 1.85 percent of the participating voters. The overall turnout at these elections was 47.4 percent.
Since the beginning of this millennium, the introduction of e-voting has been actively discussed in Estonia and a law from 2002 provided measures for preparing and implementing e-voting The coalition agreement of the coalition government, which was formed as a result of parliamentary elections in 2003 and which was from the beginning of its term in favour of using modern ICT-technologies, states: “The coalition shall aim to create the necessary conditions so that it would be possible to implement e-voting at the 2005 local government council elections”.11
- Legal Issues
Following a successful pilot in January 200512, the government strived to eventually apply e-voting and the Estonian parliament passed the “Local Government Council Election Act Amendment Act" on 28 June.13 Even though the majority of the parliament was in favour of the introduction of e-voting, there was considerable political opposition against this plan. The Estonian President, Arnold Rüütel, opposed some aspects of the proposed law, in particular the inequality between e-voters and traditional voters in the sense that e-voters could apply reversible voting during the three days (i.e. re-cast their e-votes) while this was not possible for traditional voters. Also, e-voters, in the first version of the legal text, could even annul their electronically cast vote and vote on election day at the polling place. As a compromise, Parliament abolished this second possibility, while maintaining the system of reversible e-voting. President Rüütel, however, still opposed this system and it was only when the Constitutional Court decided on 1 September14 that the proposed system did not violate the Constitution, that the President finally signed the amendment on 5 September.15
- Technical issues and proceeding
Apart from legal issues and considerations, the Estonian National Election Committee stressed prior to the elections that there were no more technical obstacles to the use of e-voting.16 Significant modifications in order to increase security have been implemented since hackers tested the system for vulnerabilities in various trial runs. The main results of these tests were the disconnection of several subsystems, police protection of the servers and the disconnection of the computer that processes the votes from the internet.
An important factor considering the introduction of e-voting was the fact that a favourable technological infrastructure was provided in Estonia, which supported the possibility of voting by internet. Amongst other things (see below), a crucial precondition was in particular the wide diffusion of electronic ID-cards17, which are equipped with a computer-readable microchip. To vote online, the voters got access to the online ballot with these ID-cards, which allow electronic personal authentication and digital signatures. The voters had to access a particular website and to introduce their electronic ID-card in a card reader, which is connected to the computer. Once identified through the ID-card and authenticated with a PIN code, a relevant candidate lists of voter’s constituency was displayed according to the voter’s identification number. Subesequently, the voter made his or her voting decision (which was encrypted via the so-called inner envelope) and confirmed his/her choice with a digital signature (the so-called outer envelope). Finally, the voter got a confirmation that the vote was recorded. The encrypted system was based on the so-called digital envelope method and used public key cryptography, which ensures the maintenance of the privacy of e-voters.18
Votes by internet could only be cast throughout three days of advance voting (6-4 days before the actual Election Day). During this period, e-voters had the possibility of electronic re-vote: they could vote more than once and only the last vote was counted.19 This measure was supposed to avoid the possibility of vote-buying.
- Implications
The Estonian authorities put forward several reasons and aims concerning the use of e-voting. A central aim was to increase the general voter turnout and particularly to reach a higher turnout of younger people. In addition, e-voting was considered an essential convenience in an information society.20 Interestingly, the Estonian parties – with the exception of two parties opposing e-voting altogether - agreed on a code of good practice for e-voting, containing several restrictions concerning election campaigning. To guarantee fair e-voting, these parties agreed to not organize collective voting actions, to not send e-campaign materials with a link to the e-voting website and to abstain from attacking the legitimacy of e-voting without objective reasons.21
The local elections were the litmus test and the largest challenge for the implementation of e-voting in Estonia. The elections are widely considered as having been a success story and it seems they will pave the way to e-voting during the legislative elections of 2007.
Because of the unique use of e-voting, the local elections gained considerable international attention. There were observers from approximately 30 countries who wished to follow the functioning of the new voting channel by internet. The possibility of online voting is under scrutiny in many countries and has been promoted as a quick and cheap way of collecting ballots. Apart from that, supporters of e-voting argue that e-voting could bolster democracy by increasing participation in elections, because it is convenient and people do not have to go to a polling station. Amongst others, the political authorities of the Kingdom of Bahrain announced that they are interested in using parts of the Estonian e-voting system for their parliamentary elections in 2007.
3 Goals of the study
The overall goal of the study was to academically monitor the political, demographic and socio-economic effects of the introduction of internet voting in the Estonian local elections of 2005. Based on the conducted telephone survey, the study aims to answer the following questions:
· Who votes online? Who prefers the traditional channel of participation at the polling place? Do the socio-demographic and socio-economic profiles of internet voters differ in any substantive way from those voting at the polling places and from those abstaining in the elections?
· How can we explain the choice of the voting channel?
· What is the impact of offering internet voting on political participation?
· What are the political effects (if there are any) of electronic voting? How politically neutral is the introduction of this channel of participation with regard to the outcome of the elections?
In answering these questions, this study will provide a detailed description and an in-depth analysis of the impact of e-voting in the local elections and the related voting behaviour of the electorate.
4 Methods
In order to answer the abovementioned questions we conducted a classic telephone survey among the Estonian electorate. This specifically designed survey contains the answers from 939 respondents who had the right to cast their ballot in the elections of October 2005. The sample consists of 315 e-voters, 319 ‘traditional’ voters (voters who cast their vote at the polling place) and 305 non-voters (abstentionists). This data allows us to undertake a thorough analysis of voting channels and voting behaviour of the Estonian electorate. The survey method used was CATI (“computer-assisted telephone interviews”) and the survey itself has been outsourced to a renowned survey institute in Estonia, called OY Uuringukeskus Faktum.22
Given the fact that only 9317 e-voters participated in the elections, a main difficulty in conducting the survey was to reach a sufficient number of e-voters. In order to overcome this difficulty, the national electoral commission, on our request, provided us with 1000 names of e-voters, randomly chosen, who participated in the elections. The phone numbers of these voters were researched, giving us 500 actual contacts, and the voters’ details were later completely anonymised by the survey institute. Considering the rather low number of e-voters, it is very satisfying that we managed eventually to interview 315 e-voters. In other words: we could get a response rate of over 60 percent among the sample of e-voters.
Before conducting the telephone survey, the project managers had already undertaken an on-line survey of e-voters during the e-voting stage of the local elections and were able to gather 70 validly filled out questionnaires. Also, the team was able to make use of an additional dataset produced by Tartu University, including roughly 300 respondents. Finally, the Estonian National Electoral Committee has given the research team - as already mentioned - access to its aggregate data within the limits of the data protection and electoral legal framework. Taken together, these data sources combine aggregate data (official statistics) with individual level data (stemming from online and offline surveys) and allowed the research team to effectively answer the above mentioned questions.
In this regard, the proponents of the study can build on a large experience with surveys in the field of e-voting. Central questions of the so-far developed questionnaires, particularly those of the e-voting pilots in the Swiss cantons of Geneva and Zurich, were re-used or adapted to the Estonian context to allow for comparability.
5 Participation in the elections of 16 October 2005
5.1 Where and when e-voters participated
To begin with the analysis of the survey results, we reduced the data concerning the geographical distribution of our respondents according to the type of settlement they live in. Their place of residence has been coded as either urban or rural, allowing us to measure whether or not the introduction of e-voting indeed creates – as it is often hypothesised in the literature – a cleavage between cosmopolitan, urbanized voters using this “hype” form of participation and their less modern, rural counterparts, preferring to rely on traditional voting methods.
The results of this bi-variate analysis are striking: there is no significant difference in the general participation pattern and the use of e-voting based on the origin of the respondents. In other words, there is no major difference or bias between towns and the country side (Table 1).
Table 1: Frequency of usual political participation and mode of vote in 2005
|
|
|
|
|
|
Type of settlement
|
Type of political participation
|
|
no vote
|
vote at polling place
|
e-vote
|
total (%)
|
urban
|
67.9%
|
67.6%
|
70.2%
|
68.6%
|
rural
|
32.1%
|
32.4%
|
29.8%
|
31.4%
|
Total
n
|
100.0%
(305)
|
100.0%
(318)
|
100.0%
(315)
|
100.0%
(938)
|
N=939, valid cases=938, missing cases=1.
Before focusing on the elections by age and gender, let us briefly try to answer the questions where and when voters cast their ballot by internet. As Figure 1 shows, a large majority of e-voters cast their e-ballot from home (54.5%) or at their workplace (36.6%). Only a very limited number of e-voters (8.9%) logged onto the system in order to vote from another place, i.e. a café, a friend’s place, a bank or a public internet access point.
Figure 1: Where e-voters cast their ballots

With regard to the timing of e-voting, we dispose of aggregate data that is based on to the entire universe of e-voters. It allows us to measure two distinct things: first, it shows us that there is a rather even distribution across the three days during which advance voting over the internet was possible (Figure 2).

Figure 2: Distribution of e-voters over the three day voting period
Source: http://www.vvk.ee/engindex.html
Second, the data shows us that while there is nearly no difference between the days when the votes by internet were cast, this appears to be different in regard to the e-voting frequency by hours. As Figure 3 shows, there are two peaks of e-voting during the day. The first one is in the morning between 9am and 10am, the second one between 6pm and 8pm. Based on these findings, one can assume that the majority of e-voters voted at the beginning of their working day and when getting home from work. The distribution between the other hours of the day is almost identical, with an almost total absence of e-voting activity between midnight and 8am.
Figure 3: Distribution of e-votes over 24 hours

Source: http://www.vvk.ee/engindex.html
5.2 Participation in elections by age and gender
Our results regarding the impact of age and gender on the choice of voting channels in the context of e-voting is of obvious interest. These results are displayed in Figure 4 and Table 2. In both cases, our survey shows very interesting results.
Considering voting behaviour by age categories, it becomes clear that above all younger people participated by voting over the internet. Figure 4 indicates how far the decision to vote at the polling station, to vote by internet or not to vote is related to the age of the respondents.
Figure 4: Age and mode of participation

The curves in Figure 4 clearly reveal that e-voting shows the inverse trend across age from the trend of voting at the polling station. The latter almost linearly increases with age while the opposite is true with regard to internet voting. Of central interest is the fact that the curve of non-voters is pretty similar to the curve of e-voters. Based on this finding, one can conclude that the introduction of voting by internet seems to have a significant impact on the participation of younger voters in elections. The use of internet voting mobilises the generally underrepresented young persons, while it is more rarely used by older voters.
Before we start analysing the potential impact of e-voting on the frequency of electoral participation, we briefly go into the question of a hypothetical gender gap introduced by e-voting. Is the latter gender-neutral or does e-voting favour one gender category over the other? First, our bi-variate analysis (Table 2) reveals that female voters are overrepresented in the Estonian electorate: in our representative sample of non-voters and voters at the polling station, women represent 354 out of 623 polled respondents, corresponding to a rate of 56.8 percent. This is indeed similar to the aggregate age-structure of the Estonian electorate.
Table 2: Gender and mode of participation
Gender
Mode of participation
|
male
|
female
|
n
|
no vote
|
45.2
|
54.8
|
305
|
vote at the polling station
|
41.2
|
58.8
|
318
|
e-vote
|
49.8
|
50.2
|
315
|
Overall n
|
426
|
512
|
938
|
N=939, valid cases=938, missing cases=1.
However, the category of e-voters is split into equal parts of male and female voters (49.8% male and 50.2% female voters). Given the fact that women are structurally more numerous within the Estonian electorate, this bi-variate finding means that male voters have been (slightly) disproportionately more mobilised by the possibility to vote over the internet than was the case with their female counterparts. In our subsequent analyses we will come back to this point in more detail in order to confirm, respectively infirm this apparent relationship between gender and voting channels.
5.3 Potential impact of e-voting on the frequency of electoral participation
In the following section, we focus on one of the most interesting aspects of the survey, the potential impact of e-voting on the frequency of electoral participation. Keeping in mind that one of the main reasons to introduce e-voting was to increase voter turnout, the following part is of major interest both from an academic and from a policy-making perspective.
First, Table 3 presents the frequency of the respondents’ usual frequency of political participation in elections and compares the latter to their concrete mode of vote in the municipal elections of 2005.
Table 3: Frequency of usual political participation and mode of vote in 2005
|
|
|
|
|
|
Vote in 2005…
|
Frequency of usual political participation
|
in all elections
|
in some elections
|
from time to time
|
never
|
Total (%, n)
|
at the polling place
|
77.6
|
18.0
|
3.5
|
0.9
|
100.0
|
by internet
|
70.2
|
24.4
|
4.8
|
0.6
|
100.0
|
|
Total (n)
|
467
|
234
|
26
|
5
|
100.0
632
|
Table 3 reveals that there is no statistically significant difference between the usual patterns of political participation of voters who voted “traditionally” or over the internet in 2005. Although among the traditional voters the very faithful voters represent 77.6 percent as compared to “only” 70.2 percent among e-voters, radical non-voters are just as rare among traditional voters as among e-voters (0.9 and 0.6 percent respectively). Occasional voters (those who indicated voting “in some elections”) are more prominently represented among e-voters than among those voting at the polling station, but overall, the figures are too similar to result in any statistically significant difference. Overall, one can therefore conclude that e-voters in the 2005 elections are not structurally different from traditional voters with regard to their normal level of political participation in elections. In other words: e-voting did not allow for the mobilization of structural abstentionists or rarely participating citizens. Rather, our results hint in the direction of a “substitution effect”: e-voters are just as frequent or infrequent voters as traditional voters, hence one could formulate the hypothesis that without e-voting our e-voters would have participated in the traditional way. Further down we will test this hypothesis more thoroughly (and eventually reject it).
We also asked the respondents to answer the question whether they believe that the introduction of e-voting could boost the frequency with which they participate in elections. Figure 5 contains the answers to this question as a function of the respondents’ usual pattern of political participation.
Figure 5: Subjective estimation of future increase in participation if e-voting is introduced as a function of the frequency of the usual pattern of political participation (n=390)23

Analysing this figure, we see two things. First, the potential for e-voting to generate an increase in political participation within the electoral arena exceeds 50 percent in all categories of non-regular voters or non-voters. Second, this subjective estimation is equally strong in all categories. This means that fundamental non-voters do not seem to be more or less affected by the introduction of e-voting than irregular voters.
The last aspect in this part focuses on e-voters in the elections and provides very interesting findings as well. Figure 6 displays the answers to the question whether the e-voters would have voted in the elections had they not had the possibility to vote by internet.
Figure 6: Subjective estimation of participation in the absence of e-voting

The most striking finding in this regard is immediately apparent.. Figure 6 reveals that two thirds (67.9%) of the e-voters would have voted anyway, even if it had not been possible to cast their vote by internet. Furthermore, another 13.6% would “probably” have voted in the case of a non-possibility to vote by internet. This means that overall 81.2% of the e-voters would have certainly or probably voted regardless of the possibility of e-voting. Only 4.9% of the e-voters would certainly not have voted if the voting channel by internet would not have been offered; 13.6% of the e-voters “probably would not have” voted in this case. In other words, only one fifth of the e-voters would (probably) not have cast their vote, if exclusively the traditional voting channels had been offered.
These findings are obviously of utmost importance with regard to the question of whether the introduction of e-voting bears the potential to increase the overall voter turnout in elections. While it is in our case certainly interesting that roughly one fifth of the e-voters would certainly or probably not have voted without having the possibility to vote by internet, the impact of this finding on the overall turnout is rather irrelevant. Given the fact that the e-voters made up only about 2 percent of the participating voters (and only about 1 percent of the overall number of citizens entitled to vote), this one fifth of e-voters has no significant impact on the overall turnout. Roughly calculated, the turnout would only have 0.2% lower with e-voting. Should e-voting become more popular, however, and should this one-fifth of otherwise abstaining citizens turn out simply because e-voting was offered, the impact on turnout could become quite tangible. But this question will have to be addressed in the future.
5.4 Subjective reasons for the choice of e-voting and future prospects
Before we go into more structural relationships explaining the choice of e-voting at the Estonian polls (part 6) we briefly present our data on the subjective reasons e-voters and traditional voters indicated for their respective choice of voting mechanisms.
First, we asked all 315 e-voters in our sample to spontaneously name the main reasons why they chose to vote over the internet. These responses were coded by the interviewers into six categories (Figure 7).
Figure 7: Subjective reasons for choosing e-voting

Note: N=315. Valid cases=314, missing cases=1.
Figure 7 clearly reveals that e-voting was above all perceived as a device that was convenient in that it made voting more speedy, practical and overall simplified participation. Three quarters of e-voters mentioned this reason as having guided their choice for voting over the internet. The second most frequently given reason relates to the “kick of the first time”: almost one fifth of all e-voters were above all curious and wanted to find out how voting over the internet worked in practice. It remains to be seen if this “first time curiosity” will fade away over consecutive experiences or if these “curious voters” become faithful to e-voting because the first experience in October 2005 was convincing to them.
In a second step we asked all voters in our sample who opted for voting at the polling place, respectively who refrained from voting altogether, to spontaneously tell us why they refrained from using the newly proposed channel of e-voting in the 2005 local elections (Figure 8).
Figure 8: Subjective reasons for not using e-voting

Note: N=626. Valid cases=621, missing cases=5.
Figure 8 reveals a very clear pattern as well. Technological hurdles (complexity or absence of internet access) were given as the major reasons for not voting over the internet by two thirds of the electorate. Less important, it seems, are reasons related to the satisfaction with the traditional system of voting which is seen as being sufficient for one fifth of our respondents. One should note the rather surprising finding that lack of trust in the system and the preservation of the ritual aspects of voting are of no importance to the traditional voters and non-voters. In particular the totally absent concern over voting rituals stands in sharp contrast to many comments in the literature on electronic voting, underlining the detrimental effect of e-voting on such rituals. It goes without saying that democratic rituals are of a rather contemporary nature in Estonia – compared to the archeo-democracies of Western Europe – but this does not necessarily mean that the newly acquired rights and electoral procedures are perceived as being less important. Indeed perhaps quite to the contrary: having fought for democracy – an experience through which the majority of the Estonian electorate lived through or actively participated in – does not mean that one is automatically more easily ready to replace the newly adopted procedures by yet another innovation. Such considerations are of utmost interest to theorists of democracy – and in particular those interested in the processes of democratization – and the introduction of electronic voting represents, from our point of view, a very fertile playground for testing the so-called “leap-frogging” thesis applied to neo-democracies.
This last comment leads us to the question of the future of e-voting in Estonia. While this future will by no means exclusively depend on the electorate’s opinion, our survey nevertheless provides some policy-relevant indications about the Estonians’ desirability for more or less e-voting.
We first asked all respondents whether they favored or rejected voting over the internet as an additional feature to pre-existing voting channels (Figure 9).
Figure 9: Attitude towards e-voting as a supplementary means of participation

Note: N=939. Valid cases=825, missing cases=114.
Figure 9 contains three curves respectively representing the opinions of non-voters, voters at the polling stations and e-voters. The pattern is very clear: a rather impressive majority of internet voters is completely in favor or e-voting (over 80 percent) with the rest being at least mostly in favor (a negligible amount of five e-voters in our sample have a rather critical view and none rejects it completely).
Non-voters and voters having chosen to go to the polls show an almost identical pattern with regard to the question of e-voting: about one third is completely in favor, between 40 and 50 percent are mostly in favor, which, added up, reveals an overwhelmingly positive attitude towards this new voting mechanism. One should stress at this point that among those respondents who actually experienced voting over the internet the attitude is almost unanimous and very strong. While it is sound to assume that predispositions to e-voting were stronger from the outset among those voters having “tried it out”, it is equally sound to assume that exposure to the system did not revert this positive predisposition. Quite to the contrary, we can assume that exposure to the system may well have intensified these predispositions, resulting in this impressive level of strong support of e-voting, something, one should rush to underline, is not necessarily self-evident.
In a further step we asked respondents whether they would use the internet for voting in several different electoral contexts, should e-voting be provided for. The respondent could indicate more than one category of elections they could think of being candidates for e-voting, hence the number of cases in this analysis (n=1080) exceeds our overall sample size (n=939). Table 4 shows theses responses according to the mode of participation of the electorate.
Table 4: Mode of participation and utility of e-voting in variable electoral contexts
Mode of participation
If e-voting could be used for other elections, would you use it in…
|
no vote
|
vote at the polling place
|
e-vote
|
n
|
…local elections
|
20.7
|
12.6
|
7.0
|
120
|
…National elections (Riigikogu)
|
8.1
|
7.6
|
4.1
|
60
|
…European Parliament elections
|
4.8
|
6.9
|
3.5
|
47
|
…Referendum
|
8.1
|
6.3
|
4.4
|
57
|
…all elections and Referendums
|
36.3
|
31.5
|
80.8
|
476
|
…never
|
21.9
|
35.0
|
0.3
|
171
|
N contained in analysis
|
270
|
317
|
343
|
931
|
Don’t know (missing)
|
82
|
56
|
11
|
149
|
Overall n
|
352
|
373
|
354
|
1080
|
Table 4 contains a number of interesting results. First, about one third of non-voters and traditional voters indicate that they could imagine using e-voting in any election or referendum process. For respondents that have already used this feature, this figure of unconditional utility in every electoral context rises to an impressive 80 percent. Second, for more selective respondents, it is the local level that enjoys primacy over all other levels of electoral competition in which e-voting is seen as a desired device. And this is the case within each category of voters and non-voters. In other words, if one does not necessarily favor a complete generalization of e-voting, then it is the local level at which this device is seen most acceptable, respectively desired. One should also note the rather large number of non-voters’ and traditional voters’ indications that they would “never” use e-voting (21.9%, respectively 35%). Also note the large number of respondents that “don’t know” among non-voters and traditional voters, showing probably some rather high level of undecidedness. This undecidedness, on the other hand, seems to be almost totally absent among voters having experienced the internet voting device.
6 Choosing the internet for voting: three explanatory models
In this part of our study we will present three partial models for explaining the choice of e-voting over voting at the polling station: a socio-demographic and economic model, a political model and an ICT model. Following our discussion of these individual, partial models, we will combine the three models into an overall, global model for explaining the choice of the channel of participation.
6.1 Socio-demographic and –economic model
We have already discussed some of the socio-demographic and –economic variables and their impact on the choice of voting over the internet, namely age, gender and the type of settlement (urban or rural). We found that age had a large impact, gender a less important impact and that the type of settlement had no impact. Before we combine our socio-demographic and –economic variables into a first partial model we would like to briefly discuss the remaining variables belonging to this category of factors that we have at hand, i.e. education, occupational status, income and language.
6.1.1 Education
The respondents in our survey were coded into four categories measuring their respective level of education, ranging from elementary/basic to secondary education/gymnasium to vocational secondary education and finally higher education.
Education is, in the comparative literature on voting behavior, correlated to participation at the polls: the higher the educational resources of a voter, the higher his or her probability to participate in elections. In the case of the local elections in Estonia this general trend is only weakly apparent. Figure 10 shows that traditional voters do have a slightly more important proportion of higher educated individuals compared to non-voters. Inversely, the proportion of non-voters having only a basic level of education is only marginally more important than its respective counterpart within the group of traditional voters. What comes out, however, of our analysis is a significant difference between e-voters with the rest of the electorate. Nearly 60 percent of e-voters dispose of a higher education level compared to 30 percent in the case of traditional voters and a good 20 percent in the case of non-voters. In other words, e-voting in Estonia was by no means “education-neutral” in that the proportion of highly educated voters within the category of e-voters is almost double the proportion among traditional voters.
Figure 10: Levels of education among voters and non-voters

Note: N=939. Valid cases=938, missing cases=1.
6.1.2 Occupational status
With regard to the occupational status of the respondents, Table 5 shows that e-voters are above all employees in both the private and public sector. Salaried workers in the public sector are even twice as strongly represented among e-voters than in the electorate as a whole (and as among non-voters and traditional voters in particular). On the other hand, retired people are clearly underrepresented, which, of course, is directly linked to the age-distribution we discussed earlier.
Table 5: Occupational status and mode of participation
Mode of participation
Occupational status
|
no vote
|
vote at the polling place
|
e-vote
|
n
|
entrepreneur, farmer, self-employed person
|
11.8
|
8.8
|
7.9
|
89
|
freelancer
|
1.6
|
0.6
|
1.0
|
10
|
salaried worker in public sector
|
16.7
|
23.6
|
42.5
|
260
|
salaried worker in private sector
|
33.4
|
27.4
|
32.7
|
292
|
student
|
9.5
|
3.5
|
4.4
|
54
|
retired
|
16.4
|
30.8
|
8.9
|
176
|
at home
|
7.9
|
3.8
|
1.6
|
41
|
unemployed
|
1.3
|
0.9
|
0.6
|
9
|
other
|
1.3
|
0.6
|
0.3
|
7
|
Total
|
100.0
|
100.0
|
100.0
|
938
|
Note: N=939. Valid cases=938, missing cases=1.
6.1.3 Income
Given the overall large socio-demographic and –economic similarities between traditional voters and non-voters it does not come as a surprise that their respective income patterns are identical, showing an inverse u-shaped curve, skewed towards the lower side of the income categories. E-voters reveal a similar pattern with, however, one important exception: the highest income-category is very largely overrepresented among e-voters. While individuals at this level of income (with an overall household income of over 7’000 Estonian Crowns) represent 12 percent of the non-voters and the traditional voters, this figure more than doubles for e-voters, rising to almost 30 percent (Figure 11).
Figure 11: Levels of income among voters and non-voters

6.1.4 Language
The ethno-linguistic structure of Estonia is dominated by two groups: Estonians and Russians. The latter represent one quarter of the population (Table 6). Among our sample of non-voters and traditional voters we therefore find 24 percent of Russian speakers. Non-voters contain 30.2 percent Russian speakers and traditional voters 17.9 percent, indicating a large linguistic cleavage when it comes to participation in the local elections: Russian speakers in Estonia participated disproportionately less in these elections. Among e-voters, they are quasi-absent: only 0.6 percent of our e-voters stem from the Russian speaking community in Estonia. This is rather unsurprising, given the fact that the official language of the e-voting system was Estonian – and despite the fact that some information material was given in Russian, almost no Russian speaker tried out this new channel of electoral participation.
Table 6: Ethnic nationality in 2004
Ethnic nationality
|
n
|
%
|
Estonians
|
924589
|
68.4
|
Russians
|
347645
|
25.7
|
Ukrainians
|
28643
|
2.1
|
Belorussians
|
16665
|
1.2
|
Finns
|
11235
|
0.8
|
Tatars
|
2540
|
0.2
|
Latvians
|
2258
|
0.2
|
Poles
|
2134
|
0.2
|
Jews
|
2003
|
0.1
|
Lithuanians
|
2090
|
0.2
|
Germans
|
1893
|
0.1
|
Other ethnic nationalities
|
9374
|
0.7
|
Total
|
1351069
|
100.0
|
Source: Official statistics from the Statistical Office of Estonia (http://www.stat.ee/)
6.1.5 The model
In order to determine the relative impact of our socio-demographic and –economic variables on the choice of e-voting over traditional participation we have specified a multivariate model that we estimate using a logistic regression. This becomes necessary as our dependent variable is dichotomous (0=traditional voting, 1=e-voting). The aim of this analysis is to show the relative impact of our independent variables that are either in an ordinal format or coded as dummies. Therefore, we can include in our model the following variables: age, gender, type of settlement (urban/rural), level of education, income and language. We had to exclude the variable measuring the occupational status of respondents as the latter cannot be recoded as an ordinal variable.
With regard to the coefficients we estimate we must underline that it is not possible to identify the spread of the effect of each variable by looking at our logistic regression coefficients (B) as the latter depends on the spread of the independent variable itself. However, the direction of the coefficient (either positive or negative) indicates the structure of the relationship between the independent variables and our dependent variable. For example, if we find a positive coefficient for the variable “income” we can say that the higher the income of a respondent, the higher his or her probability to vote by internet as opposed to voting at the polling place. Also, an important factor for the interpretation of our coefficients will be their levels of statistical significance (at the threshold of 5%).
While our bi-variate analyses have shown a number of interesting relationships, it is only through the use of a multi-variate model that we will be able to say something about their respective importance, taking into account all other independent variables.
Table 7: Multi-variate model of the impact of socio-demographic and –economic variables on choosing e-voting over voting at the polling stations among (logistic regression coefficients)
Independent variables
|
B
|
s.e.
|
sig.
|
Age
|
-.272
|
.061
|
.000
|
Gender
|
-.009
|
.183
|
.963
|
Settlement
|
-.017
|
.195
|
.929
|
Education
|
.464
|
.105
|
.000
|
Income
|
.208
|
.087
|
.016
|
Language
|
-1.757
|
.357
|
.000
|
Constant
|
.714
|
.772
|
.355
|
Pseudo R2 (Nagelkerke): .233; n=609; bold = error prob. ≤ 5%.
Table 7 shows the non-standardised regression coefficients of the six variables included in our model. Age, level of education, income and language are very significant predictors of e-voting, confirming the bi-variate relationships and their directions. However, gender and type of settlement do not exert any significant effect on the choice of e-voting over voting at the polling stations. Our bi-variate analyses already showed the absence of any urban-rural cleavage. However, our bi-variate analyses showed that men were to some extent more prone to vote over the internet than women. In the multi-variate analysis, however, this cleavage completely disappears. The overall strength of the model can be estimated by looking at the Nagelkerke’s Pseudo R2 which is .223 – a value that is not extraordinarily high (it can be interpreted as the model explaining 23 percent of the variance in the dependent variable). Clearly, other factors contribute to the explanation of why voters chose to vote over the internet rather than voting at the polling station. We therefore persevere in our investigations and subsequently estimate two alternative models to our socio-demographic and –economic model, namely a political and an ICT model.
6.2 Political model
For our political model we dispose of a series of relevant independent variables which we do not comment in detail (bi-variately) before estimating the entire model. One notable exception, however, is the variable measuring party choice among traditional voters and e-voters. This variable cannot be easily recoded into an ordinal scale and we therefore must refrain from including it in our multi-variate model.
Figure 12: Partisan choice and choice of voting channel
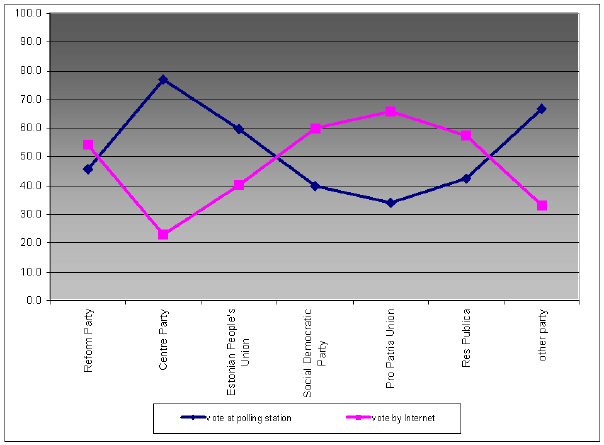
Figure 12 shows that e-voters and traditional voters do not politically behave in complete congruence. There are differences that, as long as e-voting remains a marginal phenomenon (recall that overall, there were only 1 percent of the Estonian electorate participating) it does not produce any reshaping of the political landscape in partisan terms. However, as our data show, e-voters do not only differ with regard to their socio-demographic and -economic profiles, but they also do so (quite unsurprisingly) with regard to their political preferences. Two parties are particularly affected by this: the Centre Party (clearly underrepresented among e-voters) and the Pro Patria Union (clearly over-represented among e-voters). We will come back to this point in the conclusions of our report.
We now turn our attention to the estimation of our political model. We have a set of variables at our disposal which we can include in this model. First, we have asked voters to auto-position themselves on the traditional left-right scale. Secondly, we tried to measure their level of politicization by finding out how frequently they engage in political discussions with friends and family. Thirdly, we dispose of three variables measuring the Estonian voters’ trust in Estonians political institutions and actors (trust in Parliament/government, trust in Estonian politicians, trust in the State).
Table 8: Multi-variate model of the impact of political variables on choosing e-voting over voting at the polling stations (logistic regression coefficients)
Independent variables
|
B
|
s.e.
|
sig.
|
Left-right scale
|
.143
|
.050
|
.004
|
Political discussions
|
.031
|
.110
|
.775
|
Trust in Parliament/government
|
-.475
|
.212
|
.025
|
Trust in politicians
|
-.055
|
.210
|
.795
|
Trust in the State
|
.429
|
.184
|
.020
|
Constant
|
-.355
|
.597
|
.553
|
Pseudo R2 (Nagelkerke): .058; n=475; bold = error prob. ≤ 5%.
The results contained in Table 8 show first that the left-right scale has a significant impact on the choice of e-voting. Generally, the more to the right a voter places him- or herself on this scale, the more likely his or her probability to vote over the internet. The frequency of political discussions does not, on the other hand, reveal any significant impact on this probability: whether one is politically interested and active (at least to the point of discussing politics with friends and family), or not at all does not seem to make any difference concerning the voting channel chosen. On the other hand, trust in Parliament and government is clearly associated with e-voting: the more one trusts those institutions, the more likely it is that one votes over the internet. With regard to trust in politicians, however, no such relationship can be found. Interestingly enough, when it comes to trust in the State, the relationship is inversed: the less one trusts the State, the more likely this person uses e-voting. This is quite astonishing, given the fact that it is ultimately the State that ensures the functioning of the electoral process. Could it be that – totally counter-intuitively! – those who distrust the State and its traditional electoral process with voting at the polling place are more likely to jump onto the “electronic train”, an option perceived as more trustworthy than the pre-existing one? We believe that this tricky question needs to be investigated more profoundly in the near future, as it stems from an empirical observation that is quite unique in comparative perspective.
A word concerning the explanatory power of the political model: despite the statistical significance of three out of the five variables we included in the model, the overall model-fit is very poor (Nagelkerke’s Pseudo R2 is only .058). Political variables, taken together, do therefore not seem to make a major contribution to the explanation of e-voting in Estonia.
6.3 ICT model
Our final partial model contains a set of independent variables measuring the self-assessed computing knowledge of the respondents, their frequency of internet use, the place they access the internet from, their trust in interactions on the internet (such as e-banking or buying goods over the internet) and finally their trust in the procedure of internet voting itself.
The estimation of the ICT model produces very interesting results indeed. First, let us note that of all our partial models, the ICT model has by far the largest explanatory value. Its overall fit, measured by Nagelkerke’s Pseudo R2 is .477 (Table 9).
Table 9: Multi-variate model of the impact of ICT variables on choosing e-voting over voting at the polling stations (logistic regression coefficients)
Independent variables
|
B
|
s.e.
|
sig.
|
Computing knowledge
|
-.308
|
.141
|
.029
|
Frequency of internet use
|
.119
|
.067
|
.077
|
Location of internet access
|
.145
|
.136
|
.284
|
Trust in transactions on the internet
|
-.383
|
.188
|
.041
|
Trust in the procedure of e-voting
|
-1.543
|
.194
|
.000
|
Constant
|
3.276
|
.794
|
.000
|
Pseudo R2 (Nagelkerke): .477; n=508; bold = error prob. ≤ 5%.
Three of the five entered variables exert statistically significant effects on the dependent variable. In short, the higher one’s computing knowledge, the larger one’s trust in transactions on the internet and, above all, the larger one’s trust in the procedure of e-voting itself, the higher one’s probability to vote over the internet. Interestingly enough, the variables measuring the frequency of respondents’ internet use or the location from where they access the internet do not impact on the choice for e-voting.
6.4 Global model
To conclude the analytical part of this report we have combined the three partial models presented above into an overall model for the explanation of e-voting. By including each one of our independent variables and holding constant the effects of all other explanatory variables contained in the model, we do find extremely interesting results from which a number of groundbreaking conclusions can be drawn with regard to the Estonian elections over the internet (Table 10).
Table 10: Multi-variate global model of the impact of socio-demographic and –economic, political and ICT variables on choosing e-voting over voting at the polling stations (logistic regression coefficients)
Independent variables
|
B
|
s.e.
|
sig.
|
Age
|
.267
|
.116
|
.022
|
Gender
|
.415
|
.287
|
.148
|
Settlement
|
.361
|
.316
|
.254
|
Education
|
.289
|
.181
|
.111
|
Income
|
-.166
|
.136
|
.221
|
Language
|
-1.377
|
.546
|
.012
|
Left-right scale
|
-.008
|
.073
|
.908
|
Political discussions
|
.270
|
.162
|
.095
|
Trust in Parliament/government
|
-.265
|
.342
|
.438
|
Trust in politicians
|
.188
|
.316
|
.551
|
Trust in the State
|
.516
|
.278
|
.064
|
Computing knowledge
|
-.410
|
.181
|
.023
|
Frequency of internet use
|
.153
|
.082
|
.063
|
Location of internet access
|
.247
|
.172
|
.150
|
Trust in transactions on the internet
|
-.325
|
.229
|
.156
|
Trust in the procedure of e-voting
|
-1.684
|
.244
|
.000
|
Constant
|
1.004
|
1.723
|
.560
|
Pseudo R2 (Nagelkerke): .525; n=399; bold = error prob. ≤ 5%.
To start with, the reader should note that our general model explains more than 50 percent of the total variance of the dependent variable (Nagelkerke’s Pseudo R2=.525), a result which can be considered as very satisfactory.
When simultaneously estimating the effects of all our independent variables, we first find that two of our initially significant socio-demographic and economic effects disappear completely. Levels of education as well as levels of income lose their entire explanatory power. Age and language remain strongly significant. However, note that in contrast to the partial (or baseline) socio-demographic model the age-coefficient is positive in the global model. Experimenting with various specifications has revealed that the reversed impact of age on the probability to e-vote is due to the inclusion of the ICT-variables into the model, and in particular to the inclusion of the variable “computing knowledge”. This is due to a strong negative correlation between age and the ICT variables (e.g. the correlation coefficient between the ordinal age-group variable and the variable measuring computing knowledge is .62).
Figure 13: Predicted Probabilities by age groups with ordinal age variable

Figure 13 presents the difference in the predicted probabilities to e-vote by age-groups between the partial (baseline) model and the global model. While in the first panel (representing the baseline model) of Figure 13 the probability to e-vote is upward sloping, a negative trend becomes apparent in the global specification. Obviously the monotonic behaviour of the predicted probabilities is due to the ordinal nature of the age-group variable. If we instead code the age-groups as several dummy variables and calculate predicted probabilities holding all other included variables at their sample means, the predicted probability curve becomes hump-shaped in the baseline specification as can be seen in panel A of Figure 14.
This shape more or less reflects the unconditional probabilities of the various age-groups reflecting that the other covariates in the baseline model are not strongly correlated with age. Inclusion of ICT variables, however, turns the picture upside-down as can be seen in panel B of Figure 14. Here the impact of age is less obvious although a strong upward trend is still apparent.
Figure 14: Predicted Probabilities by age groups with dummy age variables

How can these seemingly contrary pictures be reconciled? The interpretation of the changing age-effect is actually quite straightforward: Older individuals tend to have lower ICT knowledge as opposed to younger individuals. Accounting for this difference in ICT knowledge reveals - conservatively interpreted - at least no negative impact of age on the probability to e-vote. Based on this result one might speculate that as today’s younger and ICT knowledgeable cohorts grow old, the propensity to e-vote will show no age-effect in a long-term perspective even in the unconditional case.
Our political variables meet rather cruel fate: in the global model, none of them is statistically significant anymore. Left-right auto-positioning, the frequency of political discussions, trust in parliament/government and in politicians become totally irrelevant. However, although the variable measuring “trust in the State” loses its statistical significance, one should note that this is most probably due to the reduced number of cases included in the global model. In fact, the coefficient for the variable “trust in the State” is almost significant, i.e. it misses the 5 percent cut-off point by very little. Also, it continues to point in the same direction (the less trust in the State, the more probable becomes e-voting) and even slightly increases, though (evidently) its standard error goes up as well.
Among our ICT variables, this reasoning applies as well to the variable “frequency of internet use”, which - though not significant in the partial model and still not significant in the global model - now almost reaches the 5% hurdle in this general model. On the other hand, the formerly significant variable “trust in transactions over the internet” loses its significance. Computing knowledge and, above all, trust in the procedure of internet voting can maintain their structural impact on the dependent variable and remain strongly significant.
One could argue that “trust in the mechanism of e-voting” is somewhat tautological with e-voting. If such a criticism was valid, this could affect the impact of the other variables on our dependent variable. We therefore estimated a supplementary model in which we omitted this variable. Note that all the results remain exactly the same, with the exception of the “location of internet access” attaining a significant level. However, neither the strength of the coefficient, nor the latter’s standard error drastically change. They simply change enough for the coefficient to reach statistical significance at the error probability level of ≤ 5. Also note that, of course, omitting our most strongly significant variable (“trust in e-voting”) causes the overall fit of our model to decrease from .525 to .388.
7 Conclusions
Our study of the first country-wide e-elections ever held in the world is unique in that it allows us to go much further than simply commenting aggregate level results published by the authorities and taken over in newspaper articles. Our survey allowed us to finely measure the impact of socio-demographic, -economic, political and technology-related variables on the choice of e-voting on the individual level. These, from our point of view invaluable findings, can be summarized as follows.
First, e-voting in Estonia is not as seducing for elderly people as it is for younger generations among the electorate. Of course, with only one observation it is difficult to say much about the future of the attractiveness of e-voting: do e-voting-reluctant generations simply disappear over time and the younger ones, entering the electoral arena, replace them so e-voting eventually becomes attractive to all voters or will this age effect remain valid, causing older cohorts to structurally refrain from using e-voting? Though it cannot (yet) be proved, we believe that the former is the case. Studies show that once internet technologies are used by people, they continue to be used by those same people. The same would probably go for e-voting. Once people start using it, they will continue to do so. Some of our results hint exactly in this direction: our report showed that satisfaction with e-voting and its future attractiveness was particularly high among those who have actually experienced it. A very large proportion of e-voters, over 80 percent, have indeed declared that they want to use e-voting in the future and for all types of elections in which it would be proposed as an alternative means of participation.
Second, language remains a problem in a linguistically divided society, such as the Estonian one, unless the authorities offer the e-voting tool in a multi-lingual context. In Estonia, the fact that the e-voting procedure was solely in Estonian caused a very large part of the Russian speaking community to refrain from using this tool, and this is true, we should underline, with all other factors held constant. In order to seduce larger parts of the already large community of Russian speakers in Estonia (one quarter of the population) to use e-voting, offering this device in Russian becomes indispensable.
Third, computing knowledge remains a hurdle for e-voting. It is not so much the divide between “internet access haves” and “internet access have-nots”, but clearly their computing skills that made citizens chose either option of voting. Boosting computing knowledge among the population may therefore clearly boost internet voting in the future.
Fourth, independently of all other considerations, a central issue is trust of citizens in the mechanism of e-voting. Much of the use of e-voting in fact boils down to the simple question: does one trust or not this mechanism to take one’s vote correctly into account, producing trustworthy results? If this question can be answered by an unconditional, or almost unconditional “yes”, then the probability for one’s use of e-voting at the polls goes significantly up. Any successful information policy pointing in the direction of giving voters trust in the mechanism itself will therefore make this means of participation more popular.
Fifth, some non-results are of utmost importance. For instance, we found that e-voting is completely neutral with respect to such crucial variables as gender, income, education and the type of settlement – as soon as we control for our entire set of independent variables. This is not self-evident at all, but these results score quite high on a scale of truly democratic procedures. Had we found looming discrepancies according to gender or income, for instance, one could have easily criticized the new form of voting over the internet as introducing very un-democratic biases into the electoral process. This is clearly not the case.
Finally, it is the political neutrality of e-voting that is at stake. We found that e-voters behave differently from traditional voters with regard to party choice. Also, in our partial model, left-right autopositioning scored very significantly. But - and this is an important “but” - the effect of this latter variable completely disappeared in our overall model, suggesting that when controlling for all our independent variables, the initial political bias disappears. It remains to be shown whether “party choice” would have met a similar fate, but what happened to the left-right scale is most certainly the best available proxy, allowing us to assume that e-voting in Estonia, when fully analyzed, does not produce the feared political effects that become apparent at first sight. This - as well - is rather good news to promoters of e-voting as political biases introduced due to changes in voting procedures are rarely seen as being “innocent”. We believe that in the Estonian case the introduction of e-voting was politically rather innocent, indeed.
8 Recommendations
On the basis of this report, we would like to propose a number of recommendations in the field of internet voting. There are two categories of recommendations: the first addresses the concrete e-voting project in Estonia, the second aims at a larger audience willing to take internet voting towards reaching levels of best practice.
8.1 Recommendations for the future of internet voting in Estonia
A) The success of internet voting is clearly linked to the overall ICT awareness among the electorate as well as the overall diffusion of ICT-related practices. Estonia’s efforts in this field are impressive and lead to this internet-voting-favorable ground. We recommend that the efforts towards the strengthening of the information society in Estonia remain a priority for the government should e-voting become a permanent feature of Estonia’s political landscape.
B) While the technological solution of the Estonian e-voting system cannot be evaluated by the authors of the report, information gathered shows that only negligible technological problems have occurred during the e-voting trial. Also, the electoral commission did not receive any complaint (which is rather unusual!) following the elections and regarding the e-voting system put in place. In other words, the e-voting infrastructure of Estonia could well serve as “best practice” for electoral systems containing similar features. We therefore recommend to the Estonian authorities to diffuse as widely as possible their experience and technological know-how in the field of internet voting.
C) Specific to Estonia, but potentially important to any multilingual polity is the language problem. Language is a strong predictor for the choice of voting over the internet or to physically go to the polling place. Russian-speaking voters disproportionately avoided internet voting compared to Estonian speaking voters. In order not to become a means of exclusion and to give all potential voters the same opportunities to participate, we recommend that the internet voting application and related information also proposed in Russian.
D) While e-voting is an important innovation, other e-tools have been tested in the recent past, aiming at increasing citizens’ interest in politics and, if so, their participation in the electoral realm. We therefore strongly recommend the establishment of “electoral platforms” in which e-voting is an important but not exclusive element.
E) Finally, we believe that the three-day voting period for internet voting is insufficient. Extending this period would most certainly attract a number of future e-voters. The added value of voting over the internet is, amongst others, due to the freedom of choice with regard to the moment of voting. With only three days, this comparative advantage over voting at the polling place might be reduced. We therefore recommend to initiate a debate about a potential extension of the period during which e-votes can be cast.
8.2 Wider recommendations
A) Besides the introduction of internet voting in the local elections, Estonia also innovated in the setting up of a code of conduct among parties in view of such e-enabled elections. This initiative is, in our view, recommendable to other polities. It provides clear and ethical guidelines for online-campaigning and therefore avoids that e-voting is discredited due to individual parties’ behaviour.
B) Before the introduction of e-voting in any election, thorough legal analyses and preparations are a precondition for its success. All legal issues concerning the constitutionality of this form of voting as well as issues related to electoral law have to be carefully analysed and cleared. As the new instrument of voting by internet is in many regards truly innovative, it is important that it stands on sound legal grounds, which prevents doubts on the legitimacy of e-voting.
C) Prior to the introduction of e-voting in parliamentary elections on the national level, it ideally should be used in trial runs in order to test its technical reliability as well as the general functioning of the system. As in the case of the Estonian example, a three step approach seems to make sense. One can first apply the technique on a more limited scale (for instance a referendum on the local level), apply it then to a municipal election, before introducing it in national legislative elections. Such a strategy strengthens the legitimacy and reliability of e-voting.
D) The development and the provision of an accurate technical infrastructure and the clearing of any technical obstacles are crucial to guarantee a successful introduction of internet voting. Obviously, it is doubtful that such a favourable infrastructure as the one designed in Estonia (in particular the high dissemination of electronic ID-cards) could be provided in just any country, but generally several infrastructural preconditions could be established to support a successful e-voting process. In addition, our report showed the crucial factor of computing knowledge among the electorate and any public policy strengthening the latter is highly recommendable for e-voting-willing polities.
E) The Estonian approach to avoiding “family voting” and coercion in remote voting procedures is recommendable. The “reversible e-voting” mechanism, existing elsewhere, has a great potential for overcoming some of the most important fears expressed towards any form of remote voting.
F) The experiences made with regard to the use of e-voting in any particular country should be disseminated, discussed and shared with other polities, who think about introducing the possibility of internet voting. This means that successes, difficulties, problems and all interesting findings and experiences should be spread and used for establishing and strengthening further e-voting projects and endeavours. This goes in particular for technical solutions and the development of appropriate techniques to allow the introduction of e-voting. It goes without saying that the knowledge gained through the world-première in Estonia can play a crucial role in this regard.
G) Strongly related to the former point is the recommendation that e-voting should be closely accompanied by scientific/academic research. Academic monitoring of elections including the use of e-voting is a crucial instrument not only for academia, but furthermore for society as a whole.
H) Finally, e-voting solutions should be found in accordance with the Council of Europe recommendation on e-voting.24 This recommendation is a fundamental instrument whose application can go beyond Europe.
9 Executive Summary
A) Background
This report analyses the results of a survey regarding the Estonian municipal elections held on 16 October 2005. The analysis focuses on the newly introduced possibility of casting a vote via the internet in these elections. The use of this innovative voting channel gave the elections a truly unique character and brought about an important interest in the political as well as in the scientific community. The introduction of e-voting in Estonia represented a true world-première: the local elections were the first time that an electorate of an entire country could vote over the Internet in a public election. Overall, 9317 voters have used this newly introduced means of participation. This number corresponds to 1.85 percent of the participating voters.
The specifically designed telephone survey, on which the report is based, was conducted among 939 Estonian voters who had the right to cast their ballot in the elections of October 2006. The sample consists of 315 e-voters, 319 ‘traditional’ voters and 305 non-voters. The report therefore shows what voting channels have been used by what type of citizens and allows for informing its readers about participation patterns and political behaviour of the citizens in these elections.
In general, the Baltic state of Estonia seems per se particularly suitable for the pioneering use of e-voting. The country is in a leading position when it comes to the use of ICT and the internet in the private as well as in the public sector. The widespread use of ICT in Estonian society and by official bodies has developed a very broad technological infrastructure in Estonia, which strongly favoured the use of e-voting in elections.
These attitudes and this infrastructure became apparent in the Estonian approach towards e-voting. For some years, the introduction of this voting channel was discussed and legal and technical preparations paved the way to the elections of October 2005. Following a successful pilot in January 2005, the last hurdle on the way to the first elections using e-voting were concerns by the Estonian President, who was in particular critical about the fact that e-voters could apply reversible voting. When, however, the Constitutional Court decided that the proposed system did not violate the Constitution, the way for the use of e-voting in the election was free.
A central aim of the introduction of e-voting was to increase the general voter turnout and to reach a higher turnout of younger people in the elections. Importantly, the majority of the Estonian parties agreed on a code of good practice for e-voting, containing several restrictions concerning election campaigning in order to guarantee fair e-voting. The elections are widely considered as having been a success story and it seems e-voting will be introduced during the national parliamentary elections of 2007.
Because of the unique use of e-voting, the Estonian local elections gained considerable international attention. There were observers from approximately 30 countries who wished to follow the functioning of the new voting channel by internet. The possibility of online voting is under scrutiny in many countries.
To vote online in the municipal elections of October 2005, the voters got access to the online ballot using electronic ID-cards, which allow electronic personal authentication and digital signatures.25 Votes by internet could be cast throughout three days of advance voting (6-4 days before the actual Election Day) and the e-voters had to access a particular website and to introduce their electronic ID-card in a card reader, which is connected to the computer. Once identified through the ID-card and authenticated with a PIN code, a relevant candidate lists of voter’s constituency was displayed.
B) Results of the survey analysis
Considering the place of residence (rural or urban) of e-voters, there is no significant difference in the general participation pattern. In other words, there is no major difference or bias between towns and the country side.
Our results considering voting behaviour by age categories make clear that younger people participated disproportionately more over the internet. E-voting shows the inverse trend across age from the trend of voting at the polling station. The latter almost linearly increases with age while the opposite is true with regard to internet voting. Of central interest is the fact that the curve of non-voters is pretty similar to the curve of e-voters. Based on this finding, one can conclude that the introduction of voting by internet seems to have a significant impact on the participation of younger voters in elections. The use of internet voting mobilises the generally underrepresented young persons, while it is more rarely used by older voters. Focusing on gender, one can say that male voters have been (slightly) disproportionately more mobilised by the possibility to vote over the internet than this was the case with their female counterparts.
Focusing on the crucial question of the potential impact of e-voting on the frequency of electoral participation, one can conclude that e-voters in the 2005 elections are not structurally different from traditional voters with regard to their normal level of political participation in elections. In other words: e-voting did not allow for the mobilization of structural abstentionists or rarely participating citizens. When the respondent were asked whether they believed that the introduction of e-voting could increase the frequency with which they participate in elections, we found that the potential for e-voting to generate an increase in political participation within the electoral arena exceeds 50 percent in all categories of non-regular voters or non-voters. In addition, this subjective estimation is equally strong in all categories. This means that fundamental non-voters do not seem to be more or less affected by the introduction of e-voting than irregular voters. Focusing on the question of whether e-voters would have voted in the elections if they would not have had the possibility to vote by internet, reveals that overall 81.2% of the e-voters would have certainly or probably voted regardless of the possibility of e-voting. Only 4.9% of the e-voters would certainly not have voted if the voting channel by internet would not have been offered; 13.6% of the e-voters “probably would not have” voted in this case. In other words, only one fifth of the e-voters would (probably) not have cast their vote, if exclusively the traditional voting channels had been offered.
Analysing the subjective reasons why e-voters used the newly introduced voting channel, reveals that e-voting was above all perceived as a device that was convenient in that it made voting more speedy, practical and overall simplified. Three quarters of e-voters mentioned this reason as having guided their choice for voting over the internet. The second most frequently given reason relates to the “kick of the first time”: almost one fifth of all e-voters was above all curious and wanted to find out how voting over the internet worked in practice. It remains to be seen if this “first time curiosity” will fade away over consecutive experiences or if these “curious voters” become faithful to e-voting because the first experience in October 2005 was convincing to them. Asked on the other hand, why “traditional” voters refrained from voting online, technological hurdles (complexity or absence of internet access) were given as the major reasons for not voting over the internet. Less important, it seems, are reasons related to the satisfaction with the traditional system of voting which is seen as being sufficient for one fifth of the respondents.
One should note the rather surprising finding that lack of trust in the system and the preservation of the ritual aspects of voting are of no importance to the traditional voters and non-voters. In particular the totally absent concern over voting rituals stands in sharp contrast to many comments in the literature on electronic voting, underlining the detrimental effect of e-voting on such rituals. Concentrating on the future use of e-voting, about one third of non-voters and traditional voters indicate that they could imagine using e-voting. For respondents that have already used this feature, this figure of unconditional utility in every electoral context rises to an impressive 80 percent. Furthermore, for more selective respondents, it is the local level that enjoys primacy over all other levels of electoral competition in which e-voting is seen as a desired device. And this is the case within each category of voters and non-voters.
Summing up the findings of our analysis, we developed three partial models for explaining the choice of e-voting: a socio-demographic and economic model, a political model and an ICT model. These individual models were combined into an overall, global model for explaining the choice of the channel of participation.
Combining the three partial models into an overall model for the explanation of e-voting, the report offers interesting results from which a number of fundamental conclusions can be drawn. When estimating the effects of all our independent variables at the same time, we first find that two of our initially significant socio-demographic and economic effects disappear completely: levels of education as well as levels of income lose their entire explanatory power. Age and language, however, remain strongly significant. The political variables lose any statistically significance in the global model: Left-right auto-positioning, the frequency of political discussions, trust in parliament/government and in politicians become totally irrelevant. Focusing on the ICT variables, the main finding of the global model is that computing knowledge and trust in the procedure of internet voting can maintain their structural impact on the dependent variable and remain strongly significant.
To sum up: e-voting in Estonia is not as seducing for elderly people as it is for younger generations among the electorate. Of course, with only one observation it is difficult to say much about the future of the attractiveness of e-voting: do e-voting-reluctant generations simply disappear over time and the younger ones, entering the electoral arena, replace them so e-voting eventually becomes attractive to all voters or will this age effect remain valid, causing older cohorts to structurally refrain from using e-voting? We believe that the former is the case as some of our findings hint in that direction.
On the individual level, computing knowledge remains an important factor regarding e-voting. Their computing skills make citizens chose either option of voting.
A related and central issue is trust of citizens in the mechanism of e-voting. When people think that the e-voting mechanism takes one’s vote correctly into account, then this increases significantly the probability of using e-voting.
The result that e-voting is completely neutral with respect to such crucial variables as gender, income, education and the type of settlement (at least when we control for the entire set of independent variables) is of crucial importance. This finding is central from a democracy-theoretical perspective, as an opposite finding could have indicated that voting over the internet would lead to un-democratic biases in the electoral process.
While left-right autopositioning scored significantly in our partial model, the effect of this variable completely disappeared in our overall model. This finding allows us to assume that e-voting in Estonia, does not produce the feared political effects that become apparent at first sight. This finding is as well positive, as political biases introduced due to changes in voting procedures are generally to be avoided.
Annex on Research Management of the study
The research management was collaborative, involving two project leaders (Prof. Alexander H. Trechsel and Mr. Ivar Tallo), affiliated to three leading organisations in their respective fields (the e-Democracy Centre, the e-Governance Academy and the European University Institute). Both project leaders can count on a track record of working for the Council of Europe in the general fields of democracy, technology, corruption and, more particularly, in the field of e-voting. The European University Institute has been chosen as the administrative partner as it can count on substantial experience in financial and administrative project management.
Furthermore, Ms. Liia Hänni and Mr. Fabian Breuer were actively participating in this project. Ms. Hänni of the “e-Governance Academy” in Tallinn was in charge of managing the contacts and information exchange with the Estonian survey institute. Also, she gave the project an overall intellectual input with regard to the questionnaire design and the wrapping-up of the report. Mr. Fabian Breuer worked as a research assistant for the European University Institute’s part of the project. Finishing his PhD in Political Science at the EUI and having previously worked in the field of marketing research, Fabian Breuer’s competence led him to co-author this report.
The e-Democracy Centre (e-DC)
The “e-Democracy Centre” (e-DC) is one of the first interdisciplinary research centres dedicated to the study of e-democracy. Its main goal is to improve the understanding of how new information and communication technologies are interacting with our democratic institutions of governance and the outcomes that are being produced as a result of this interaction. To attain this goal e-DC strives to pursue interdisciplinary research of the highest intellectual quality with a view to generating scholarly debate and informing the research and policy communities. From its inception the e-DC has been fortunate in being able to rely on the support of three leading research institutes: the Research and Documentation Centre on Direct Democracy (c2d), at the University of Geneva, the European University Institute (EUI) at Florence and the Oxford Internet Institute (OII) at the University of Oxford. A dynamic network of young researchers and senior academics has also provided invaluable encouragement and assistance for launching the e-DC. By providing a forum through which the network of researchers affiliated to the e-DC can exchange ideas, disseminate research findings and collaborate to develop new research tools and launch new projects, e-DC aims to consolidate our knowledge base in this field.
Concerning the topic of e-voting the “e-Democracy Centre“ (e-DC) can rely on significant research experience. Its director, Alexander H. Trechsel, has co-ordinated numerous research projects in this field, including the design of on- and offline questionnaires and surveys. Equally numerous are the scientific reports and publications (including books at renowned publishing houses, such as Routledge) stemming from these research projects. Also, this research output has always been keen to present its major results in accordance to the needs of the policy making community, in particular through the production of policy papers and policy briefs (for more details see http://edc.unige.ch).
The e-Governance Academy
The e-Governance Academy is a non-profit organization founded for the creation and transfer of knowledge concerning e-governance, which is understood to include e-democracy. Focusing on supporting policy rather then on gathering theoretical or technical knowledge, the Academy strives to work both with peer institutions in countries already advanced in e-governance as well as individuals and institutions in the target countries. The e-Governance Academy provides a platform for analysing both international and domestic experience into practical and applicable knowledge that can be transferred to those interested both at home and abroad.
Its primary geographical focus remains on the countries of the Commonwealth of Independent States (CIS, particularly the Caucasus and Central Asia), Mongolia and South Eastern Europe. While retaining its mission of knowledge transfer to the East the e-Governance Academy is gradually becoming an acknowledged partner for institutions of other Member States of the European Union.
The Academy implements its mission through the provision of training services and advisory missions, organizing research, enabling networking and facilitating exchange of experience in broad areas of e-governance. Located in Tallinn, Estonia, the Academy draws on both the experiences of the country and achievements from other, both developed and transition, countries. The target audience of the Academy's activities are senior policy-makers and governmental Information and ICT-specialists, as well as researchers working on the issues of e-governance. Note that the Academy’s director, Ivar Tallo, is also a senior research associate of the e-DC (for more details see http://www.ega.ee).
The European University Institute (EUI)
The EUI, where the project was administratively managed, has a distinguished record of social science research. The reasons for this can be found in the very unique status and mission of the Institute, founded over twenty five years ago to promote advanced academic training for PhD students and research at the highest level with a special emphasis on European Union studies. Nowadays the EUI plays host to over 300 postgraduate students from all the member states of the European Union and beyond, as well as a large number of professors, visiting professors and post-doctoral fellows. The international makeup and multidisciplinary structure of the EUI is ideal for collaboration in a project of this kind. The EUI also employs administrative staff tasked with research project support (for more details see http://www.iue.it).


 Print
Print  Send
Send 